The Great Instagram Purge, Measured: Who Really Lost Followers
The median Instagram account with 10,000 or more followers lost 0.59% of its followers in the May 2026 purge, well below the 2% to 5% reported at the time. One account in five lost more than 2%, and few of those came back.
The Instagram bot purge of May 2026 did real but uneven damage. The losses line up closely with audience quality and with whether an account was still posting, and most of the accounts that lost the most have not recovered. TikTok and YouTube, measured the same way, show no matching drop.
-0.59%
The median Instagram account with 10K+ followers changed by -0.59% between April and May 2026.
95% CI -0.62% to -0.56%. A normal month is -0.08%.
20.0%
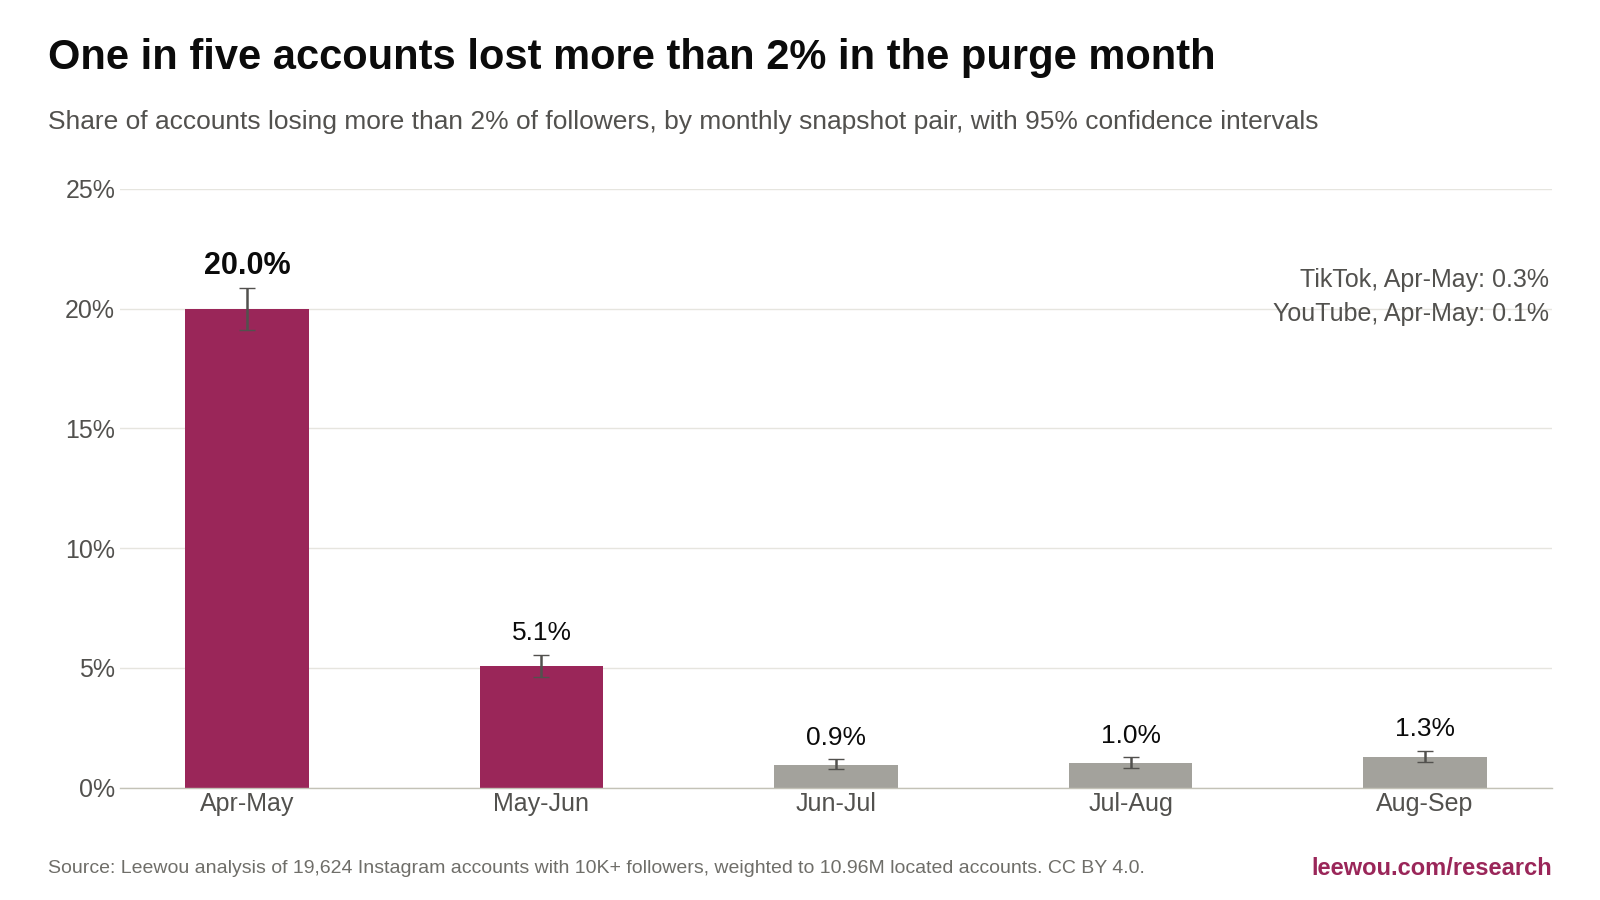
One in five accounts lost more than 2% of its followers in the purge month, against 1.1% in a normal month.
95% CI 19.1% to 20.9%.
40.0% vs 2.3%
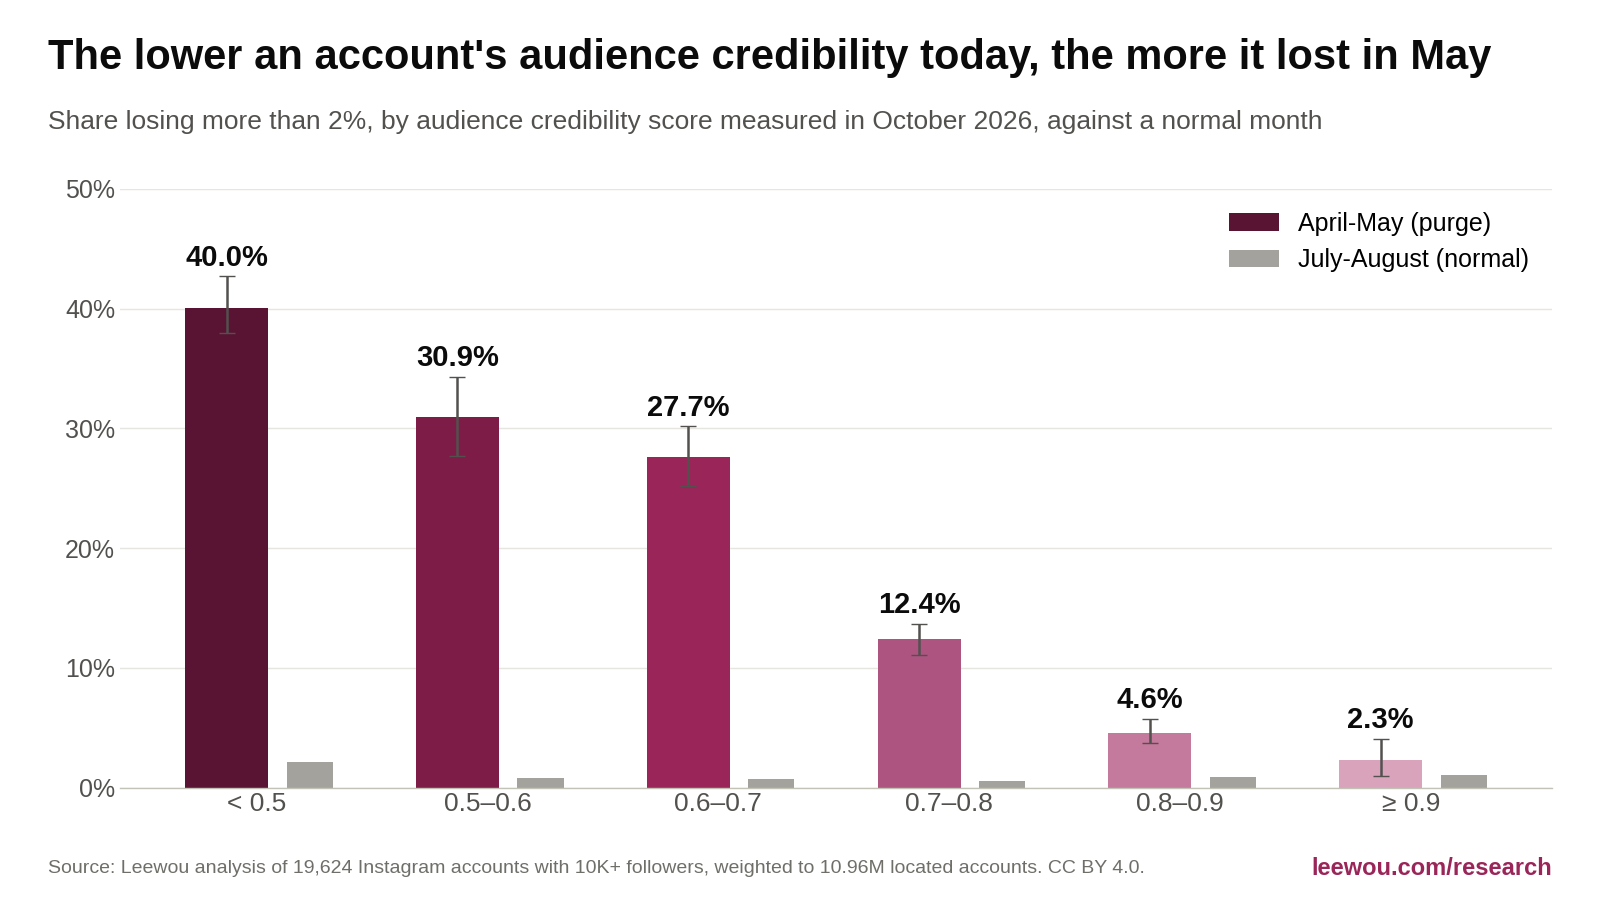
Accounts with an audience credibility score under 0.5 today lost more than 2% about 17 times as often as accounts scoring 0.9 or higher.
Credibility is a modelled estimate measured in October, after the purge.
6.5 billion
The accounts in our population ended the purge month about 6.5 billion follows short of a normal month, or 0.9% of their combined followers.
95% CI 5.8 to 7.3 billion. Follows, not accounts.
3.8%
Only 3.8% of accounts that lost more than 2% were back at their April follower count by September.
95% CI 2.9% to 4.8%.
61%
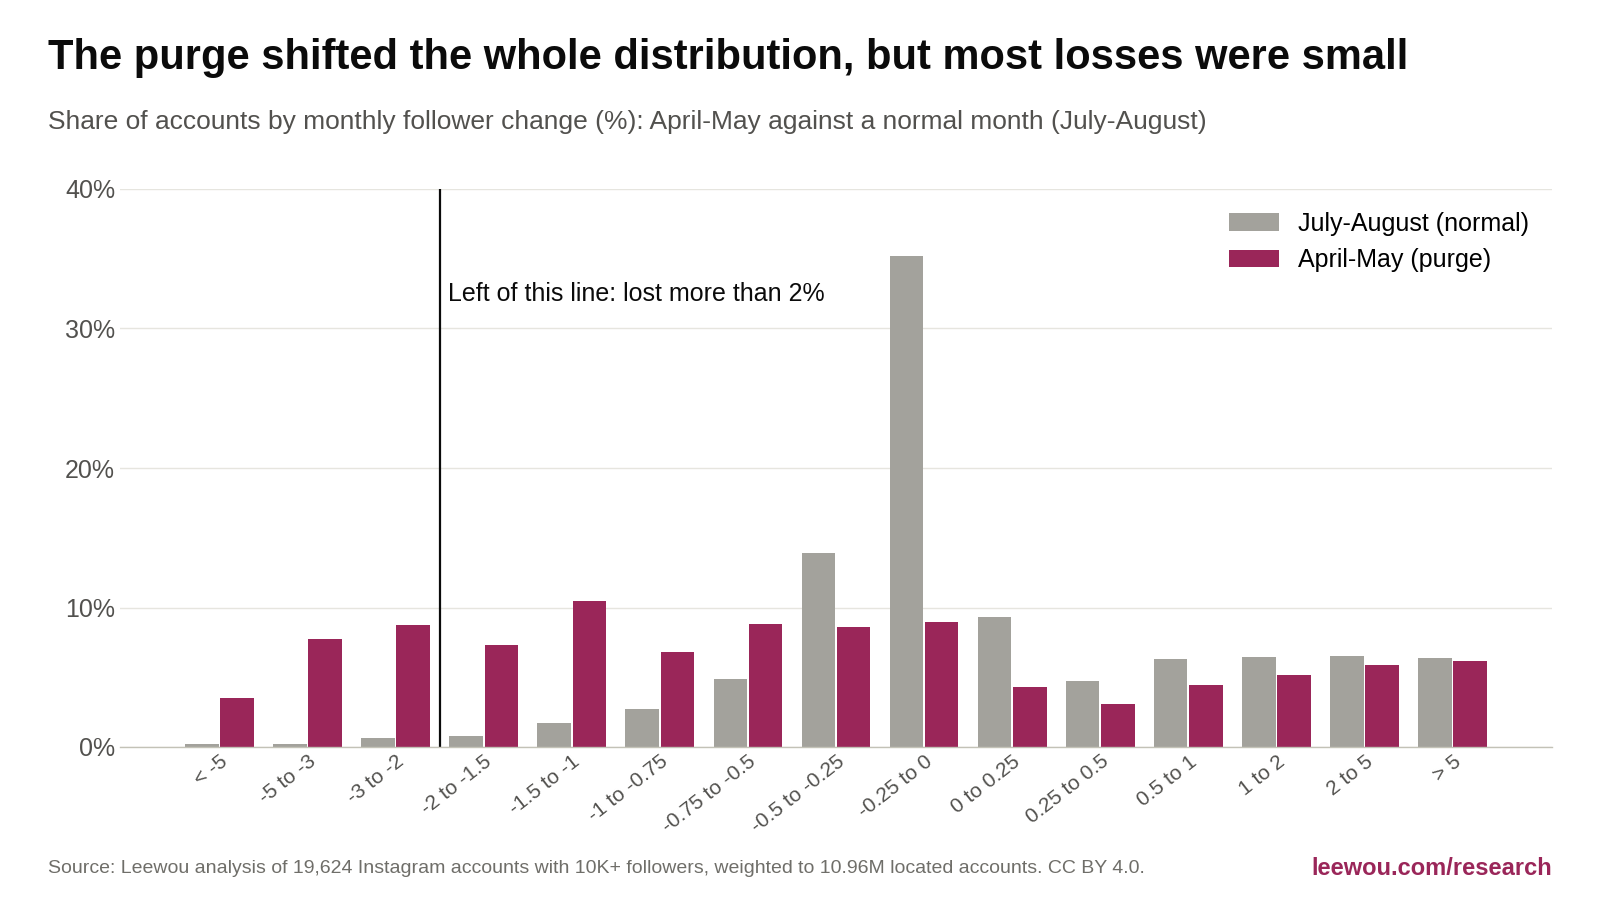
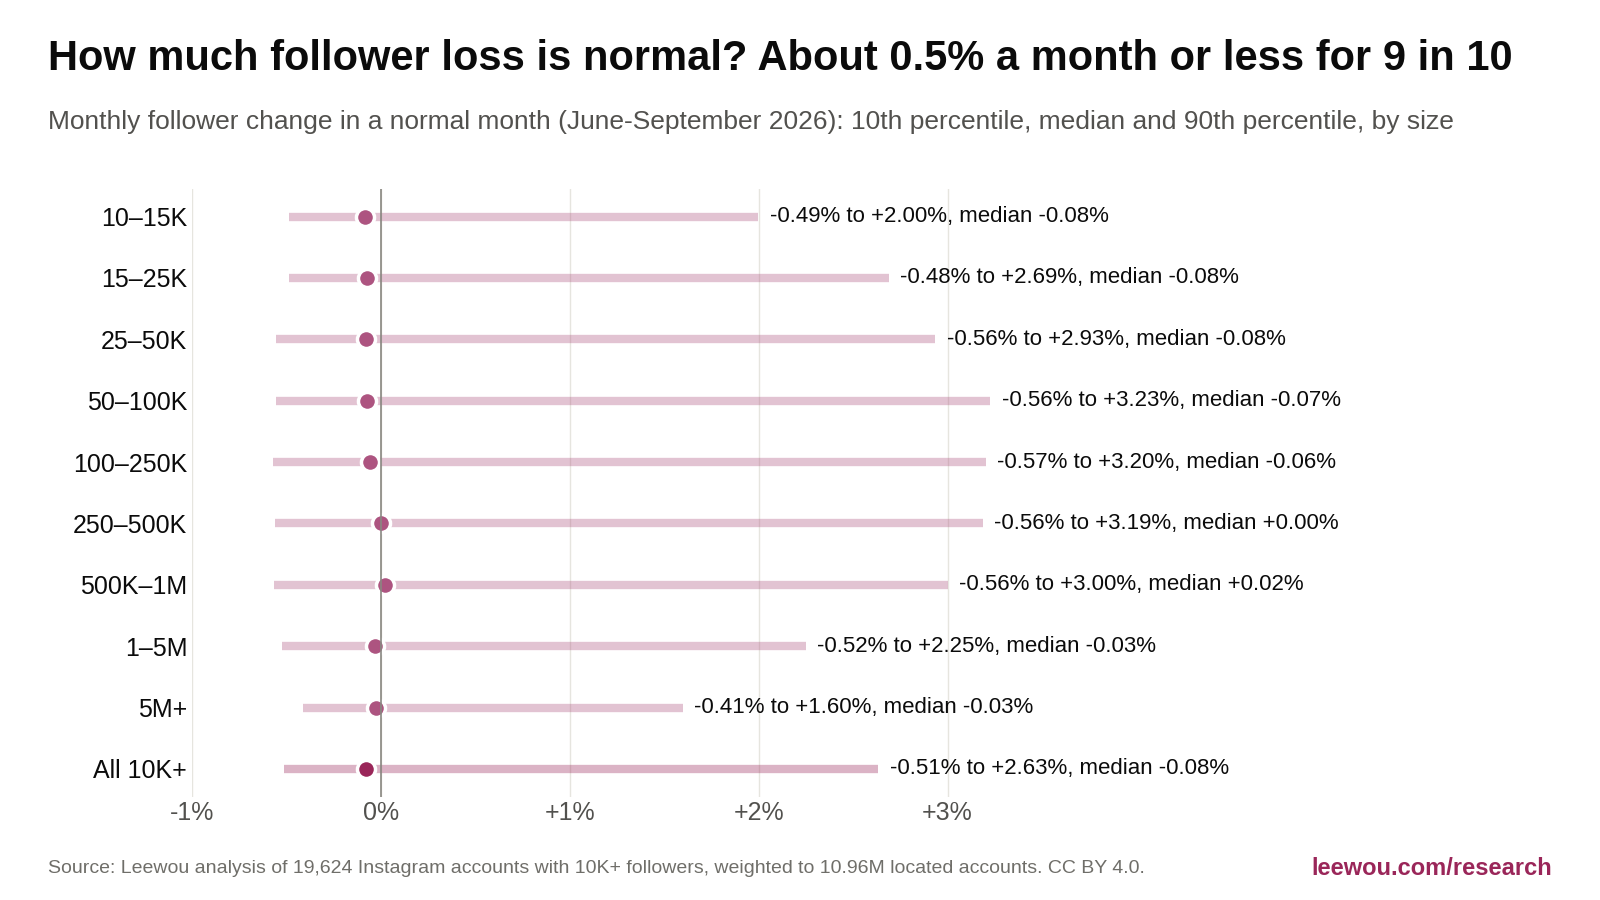
In a normal month, 61% of Instagram accounts with 10K+ followers lose followers, and 9 in 10 lose about 0.5% or less.
June to September 2026.
How we measured this
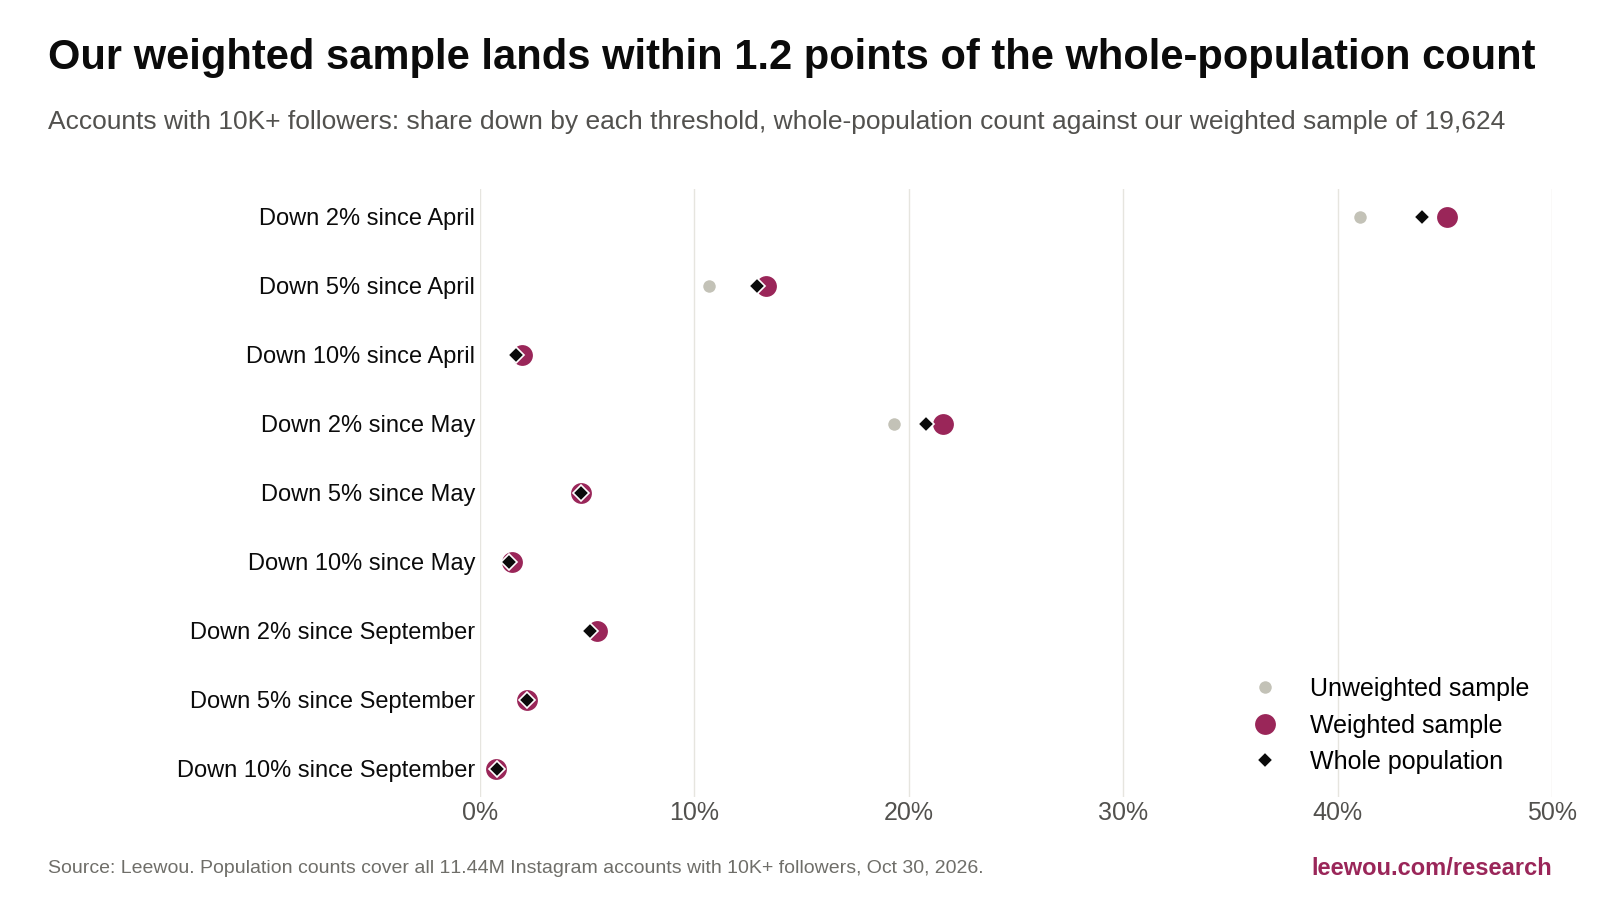
On October 30 and 31, 2026, we pulled analytics reports for 19,803 Instagram accounts with 10,000 or more followers from Leewou's proprietary creator index, built on public profile data. Each report holds monthly follower readings from April to October 2026, so every account has its own before and after. We weighted the 19,624 accounts with a known country to match the 10.96 million located accounts in the index, by country and size, and used 3,120 TikTok and 1,578 YouTube accounts as controls. On nine separate measures, the weighted sample lands within 1.2 points of whole-population counts across all 11.44 million accounts. A live check of 487 profiles against an independent source matched within 2% on 96.3% of them. Read the full method.
| Measure | Whole population | Weighted sample | 95% CI | Unweighted sample |
|---|---|---|---|---|
| Down more than 2% since april | 43.95% | 45.12% | 44.06 to 46.24 | 41.06% |
| Down more than 5% since april | 12.91% | 13.35% | 12.64 to 14.14 | 10.66% |
| Down more than 10% since april | 1.70% | 1.95% | 1.65 to 2.27 | 1.70% |
| Down more than 2% since may | 20.78% | 21.60% | 20.82 to 22.54 | 19.33% |
| Down more than 5% since may | 4.73% | 4.71% | 4.28 to 5.19 | 4.46% |
| Down more than 10% since may | 1.37% | 1.51% | 1.24 to 1.80 | 1.34% |
| Down more than 2% since september | 5.13% | 5.48% | 5.01 to 5.99 | 5.44% |
| Down more than 5% since september | 2.21% | 2.18% | 1.89 to 2.52 | 2.21% |
| Down more than 10% since september | 0.77% | 0.75% | 0.58 to 0.94 | 0.75% |
How many followers did accounts lose in the Instagram purge?
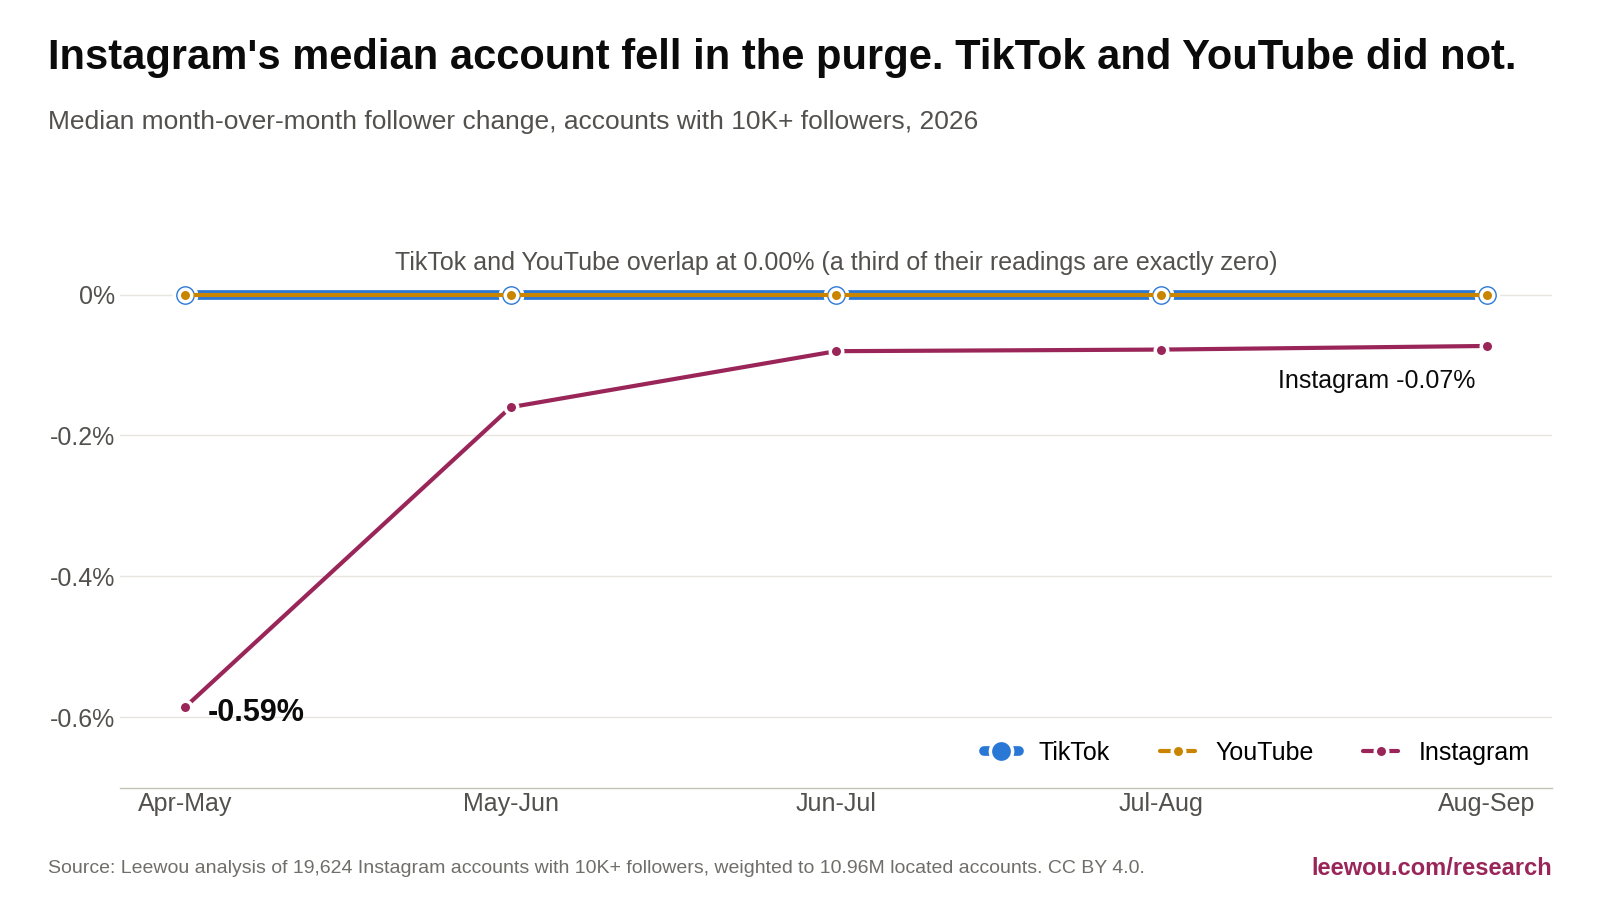
The median account lost 0.59% between the April and May readings (95% CI -0.62% to -0.56%), about seven times the -0.08% of a normal month. Reports at the time said small and mid-sized creators had lost between 2% and 5%. In our data only 16.5% of accounts landed in that range, 3.5% lost more than 5%, and 29% grew anyway. Counting every account rather than a sample, 44.0% of the 11.44 million Instagram accounts with 10,000 or more followers were down more than 2% in late October compared with April, against 13.0% of TikTok accounts and 2.1% of YouTube accounts at the same size.
| Transition | Instagram median | 95% CI | n | TikTok median | n | YouTube median | n |
|---|---|---|---|---|---|---|---|
| Apr-May | -0.59% | -0.62 to -0.56 | 19,103 | 0.00% | 3,107 | 0.00% | 1,576 |
| May-Jun | -0.16% | -0.17 to -0.15 | 19,226 | 0.00% | 3,108 | 0.00% | 1,577 |
| Jun-Jul | -0.08% | -0.09 to -0.08 | 19,308 | 0.00% | 3,120 | 0.00% | 1,578 |
| Jul-Aug | -0.08% | -0.08 to -0.07 | 19,404 | 0.00% | 3,120 | 0.00% | 1,578 |
| Aug-Sep | -0.07% | -0.08 to -0.07 | 19,542 | 0.00% | 3,120 | 0.00% | 1,578 |
TikTok and YouTube are the control group, and they hold up. About a third of their monthly readings show exactly zero change, so their medians mean little. The share of accounts losing more than 2% is sturdier. Against its June to September baseline, Instagram's share rose by 18.9 points in the purge month (95% CI 18.0 to 19.8). TikTok rose by 0.04 points and YouTube by 0.07, both indistinguishable from zero.
| Transition | Instagram lost >2% | 95% CI | TikTok lost >2% | 95% CI | YouTube lost >2% | 95% CI |
|---|---|---|---|---|---|---|
| Apr-May | 20.0% | 19.1 to 20.9 | 0.3% | 0.1 to 0.5 | 0.1% | 0.0 to 0.3 |
| May-Jun | 5.1% | 4.6 to 5.5 | 0.3% | 0.1 to 0.6 | 0.0% | 0.0 to 0.0 |
| Jun-Jul | 0.9% | 0.8 to 1.2 | 0.2% | 0.0 to 0.4 | 0.1% | 0.0 to 0.3 |
| Jul-Aug | 1.0% | 0.8 to 1.3 | 0.3% | 0.1 to 0.5 | 0.0% | 0.0 to 0.0 |
| Aug-Sep | 1.3% | 1.1 to 1.5 | 0.2% | 0.0 to 0.4 | 0.0% | 0.0 to 0.0 |
| Follower change (%) | April-May | July-August |
|---|---|---|
| < -5 | 3.5% | 0.2% |
| -5 to -3 | 7.8% | 0.2% |
| -3 to -2 | 8.7% | 0.6% |
| -2 to -1.5 | 7.3% | 0.8% |
| -1.5 to -1 | 10.4% | 1.7% |
| -1 to -0.75 | 6.8% | 2.7% |
| -0.75 to -0.5 | 8.8% | 4.9% |
| -0.5 to -0.25 | 8.6% | 13.9% |
| -0.25 to 0 | 8.9% | 35.2% |
| 0 to 0.25 | 4.3% | 9.3% |
| 0.25 to 0.5 | 3.1% | 4.7% |
| 0.5 to 1 | 4.4% | 6.3% |
| 1 to 2 | 5.2% | 6.4% |
| 2 to 5 | 5.9% | 6.5% |
| > 5 | 6.2% | 6.4% |
In total, about 6.5 billion follows went missing. These accounts added roughly 6 billion followers in an ordinary month but lost a net 0.56 billion in the purge month, a gap of 6.5 billion (95% CI 5.8 to 7.3 billion), or 0.9% of their combined 741 billion followers. That counts follows, not accounts: one removed account that followed 500 creators counts 500 times. Meta has not published a total.
Did Instagram remove fake followers?
The losses line up strongly with an audience-quality score calculated separately from follower history, which points toward low-quality followers, although we cannot see which individual followers left. Meta's account, relayed through media reports, was that this was routine removal of inactive accounts and that "active followers remain unaffected".
| Credibility (Oct 2026) | n | Median Apr-May | 95% CI | Lost >2% Apr-May | 95% CI | Lost >2% Jul-Aug |
|---|---|---|---|---|---|---|
| < 0.5 | 3,286 | -1.45% | -1.62 to -1.33 | 40.0% | 37.9 to 42.7 | 2.1% |
| 0.5-0.6 | 1,470 | -1.23% | -1.39 to -1.03 | 30.9% | 27.7 to 34.3 | 0.8% |
| 0.6-0.7 | 3,113 | -0.95% | -1.05 to -0.87 | 27.7% | 25.2 to 30.2 | 0.7% |
| 0.7-0.8 | 5,800 | -0.49% | -0.54 to -0.44 | 12.4% | 11.1 to 13.7 | 0.5% |
| 0.8-0.9 | 4,438 | +0.02% | -0.06 to 0.11 | 4.6% | 3.7 to 5.7 | 0.9% |
| ≥ 0.9 | 575 | +0.68% | 0.32 to 1.22 | 2.3% | 1.0 to 4.0 | 1.1% |
The pattern survives the checks we ran. Low scorers lost more than high scorers within small, mid-sized and large accounts and within the United States, Brazil and India, though the steps are not perfectly even in every cut. It also appears in the whole-population counts, which do not rely on our sample at all: across all accounts, 68.6% of those scoring 0.5 to 0.6 are down more than 2% since April, against 24.5% of those at 0.9 or higher. Credibility was measured in October, after the purge, so this says accounts with lower credibility today lost more in May. It does not say the score predicted anything, and it is not evidence that any account bought followers.
Why am I losing followers on Instagram?
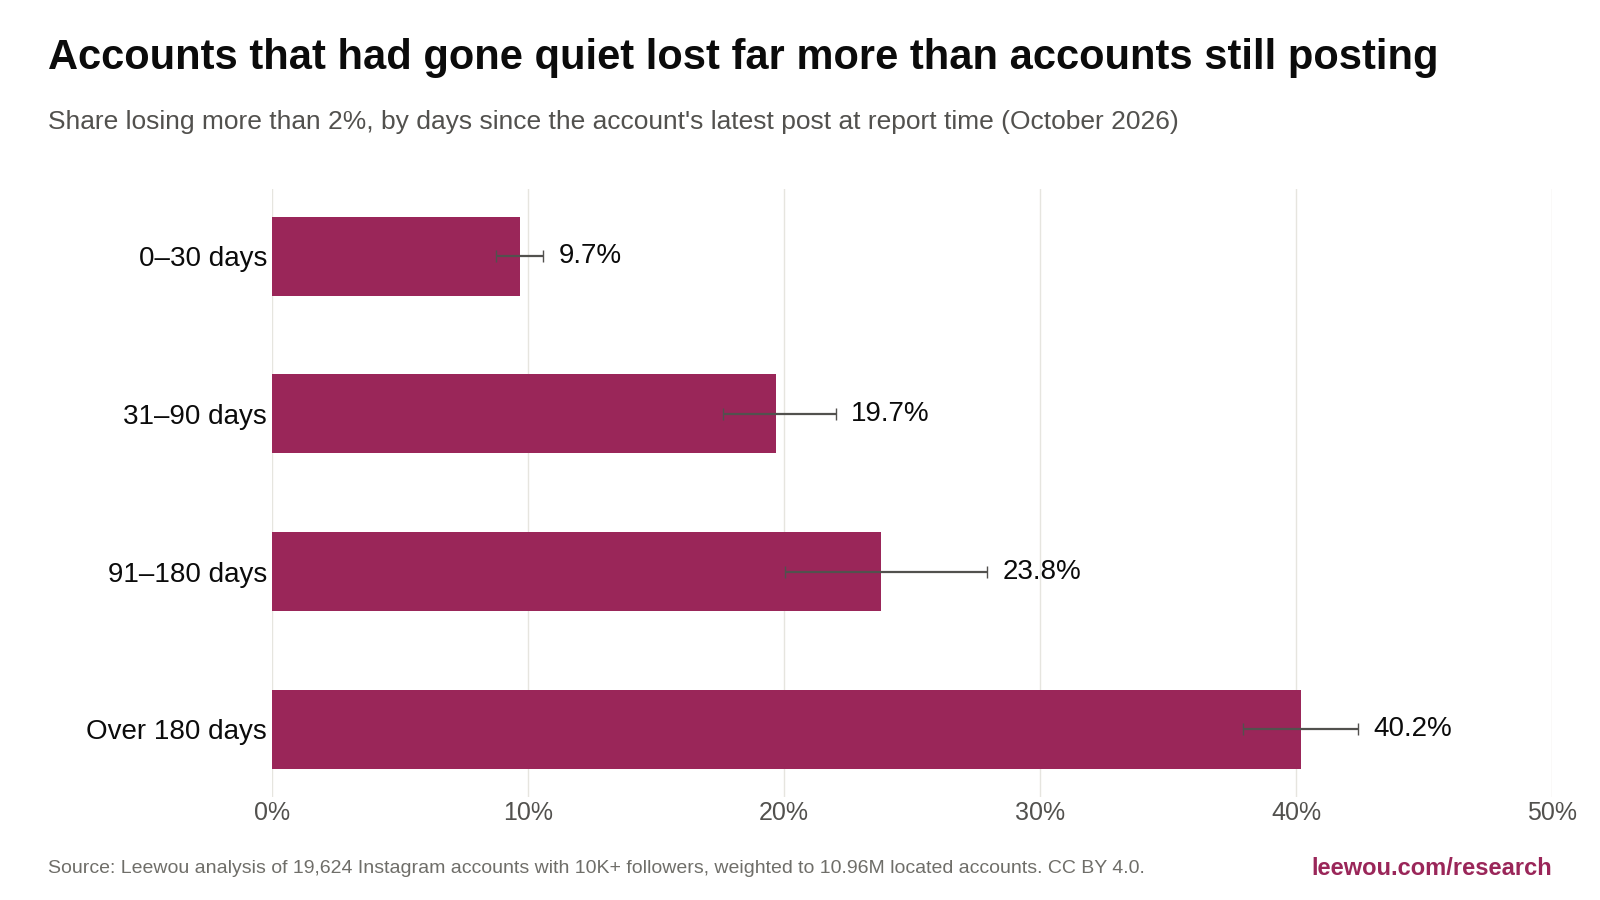
If the drop came in May 2026, the cleanup is the likely cause, and accounts that had stopped posting were hit hardest. If you keep losing followers now, it is probably ordinary drift, which affects most accounts in most months.
| Latest post | n | Median Apr-May | Lost >2% Apr-May | 95% CI | Lost >2% Jul-Aug |
|---|---|---|---|---|---|
| 0-30 days | 10,891 | -0.13% | 9.7% | 8.7 to 10.6 | 1.0% |
| 31-90 days | 3,492 | -0.62% | 19.7% | 17.6 to 22.0 | 1.4% |
| 91-180 days | 1,035 | -0.99% | 23.8% | 20.1 to 27.9 | 2.0% |
| Over 180 days | 3,605 | -1.51% | 40.2% | 37.9 to 42.4 | 0.5% |
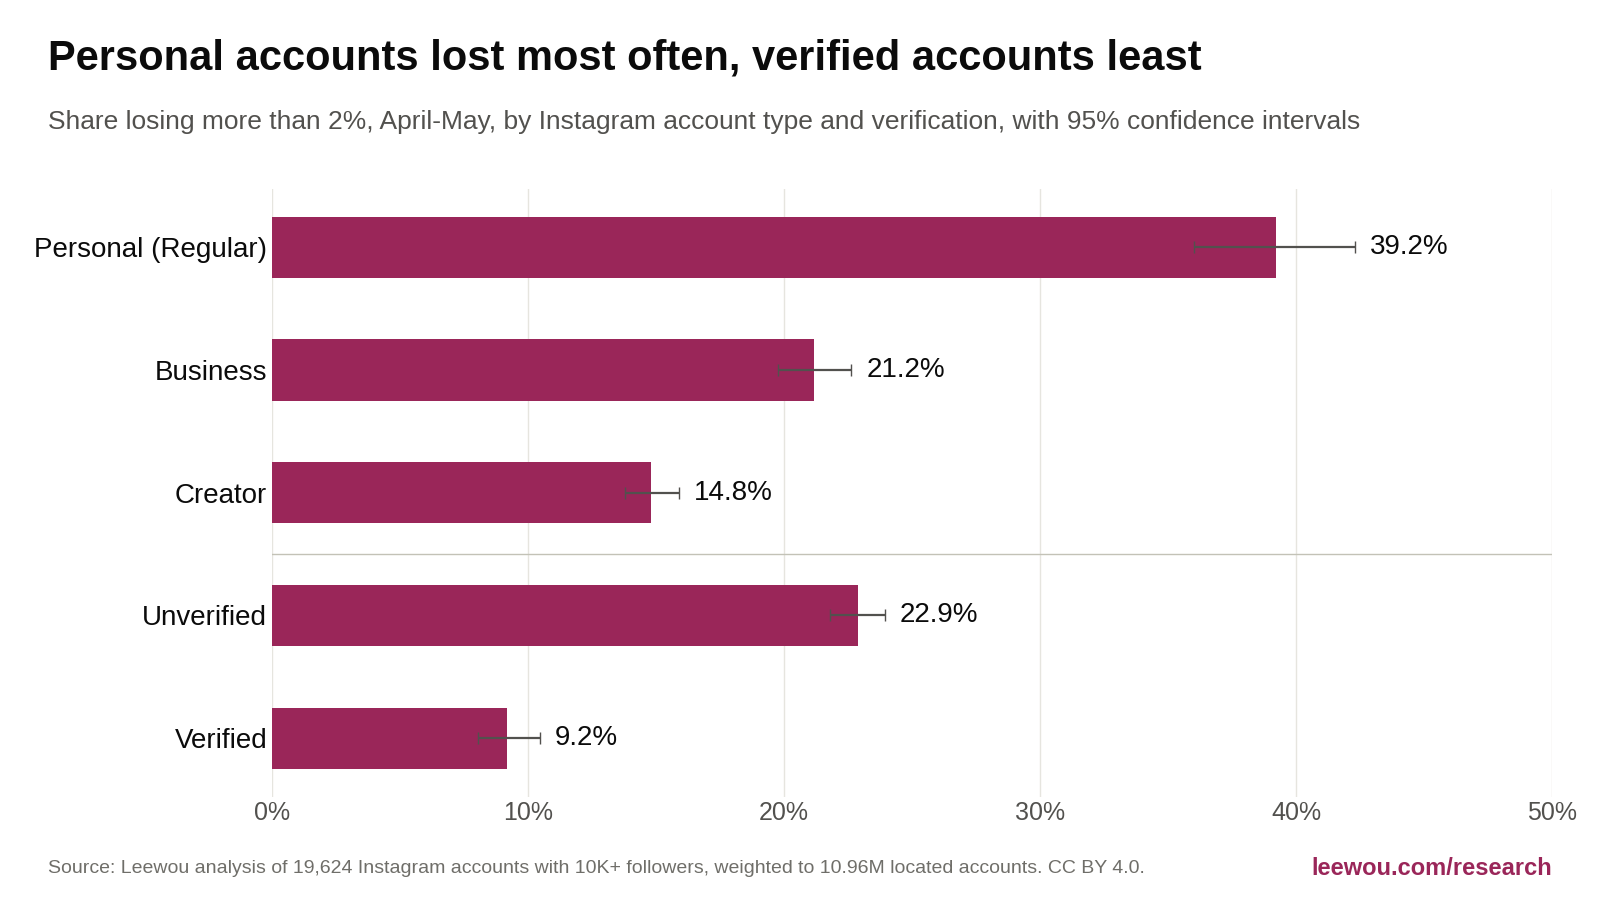
Quiet accounts do not simply lack new followers to cover the loss, because in a normal month they lose more than 2% only 0.5% of the time. The gap also holds among accounts with high-credibility audiences: 15.0% of quiet accounts scoring 0.8 or above lost more than 2%, against 2.1% of active ones. Account type mattered too, and verification did even at the same credibility: in the 0.7 to 0.8 band, 14.3% of unverified accounts lost more than 2%, against 5.2% of verified ones. Accounts whose audience is mostly abroad also lost more: 26.7% where under a quarter of the audience is in the creator's country, against 15.6% where at least three quarters is. To see where your own account stands, run it through the Instagram account analyzer.
| Segment | n | Median Apr-May | Lost >2% Apr-May | 95% CI | Lost >2% Jul-Aug |
|---|---|---|---|---|---|
| Personal (Regular) | 1,784 | -1.36% | 39.2% | 36.0 to 42.3 | 2.1% |
| Business | 7,041 | -0.52% | 21.2% | 19.8 to 22.6 | 0.6% |
| Creator | 10,278 | -0.49% | 14.8% | 13.8 to 15.9 | 1.0% |
| Unverified | 13,078 | -0.70% | 22.9% | 21.8 to 23.9 | 1.0% |
| Verified | 6,025 | -0.13% | 9.2% | 8.0 to 10.5 | 1.0% |
Is it normal to lose followers on Instagram?
Yes. In a normal month, 61% of Instagram accounts with 10,000 or more followers lose followers, the median change is -0.08%, and 9 in 10 accounts lose about 0.5% or less. Losing more than 2% in a month is rare: it happens to 1.1% of accounts. Size barely changes this, and the floor sits near -0.5% from 10,000 followers to 5 million.
| Followers (Oct 2026) | Accounts | Lowest 10% start at | Median | Top 10% start at | Share that fell | Lost >2% |
|---|---|---|---|---|---|---|
| All 10K+ | 19,624 | -0.51% | -0.08% | +2.63% | 61.3% | 1.1% |
| 10–15K | 3,565 | -0.49% | -0.08% | +2.00% | 64.8% | 1.1% |
| 15–25K | 3,181 | -0.48% | -0.08% | +2.69% | 61.9% | 1.2% |
| 25–50K | 3,427 | -0.56% | -0.08% | +2.93% | 60.4% | 1.1% |
| 50–100K | 3,029 | -0.56% | -0.07% | +3.23% | 58.2% | 1.0% |
| 100–250K | 2,391 | -0.57% | -0.06% | +3.20% | 55.2% | 0.9% |
| 250–500K | 1,611 | -0.56% | 0.00% | +3.19% | 50.0% | 0.8% |
| 500K–1M | 1,242 | -0.56% | +0.02% | +3.00% | 48.5% | 1.1% |
| 1–5M | 894 | -0.52% | -0.03% | +2.25% | 52.8% | 0.9% |
| 5M+ | 284 | -0.41% | -0.03% | +1.60% | 51.6% | 1.0% |
Which Instagram accounts lost the most in the purge?
Smaller accounts were hit most often: 23.2% of accounts with 10,000 to 15,000 followers lost more than 2%, against 9.4% at 500,000 to 1 million. The very largest accounts lost more in percentage terms, though. Accounts with 5 million or more followers show the deepest median of any band at -0.90%, on a smaller sample of 283.
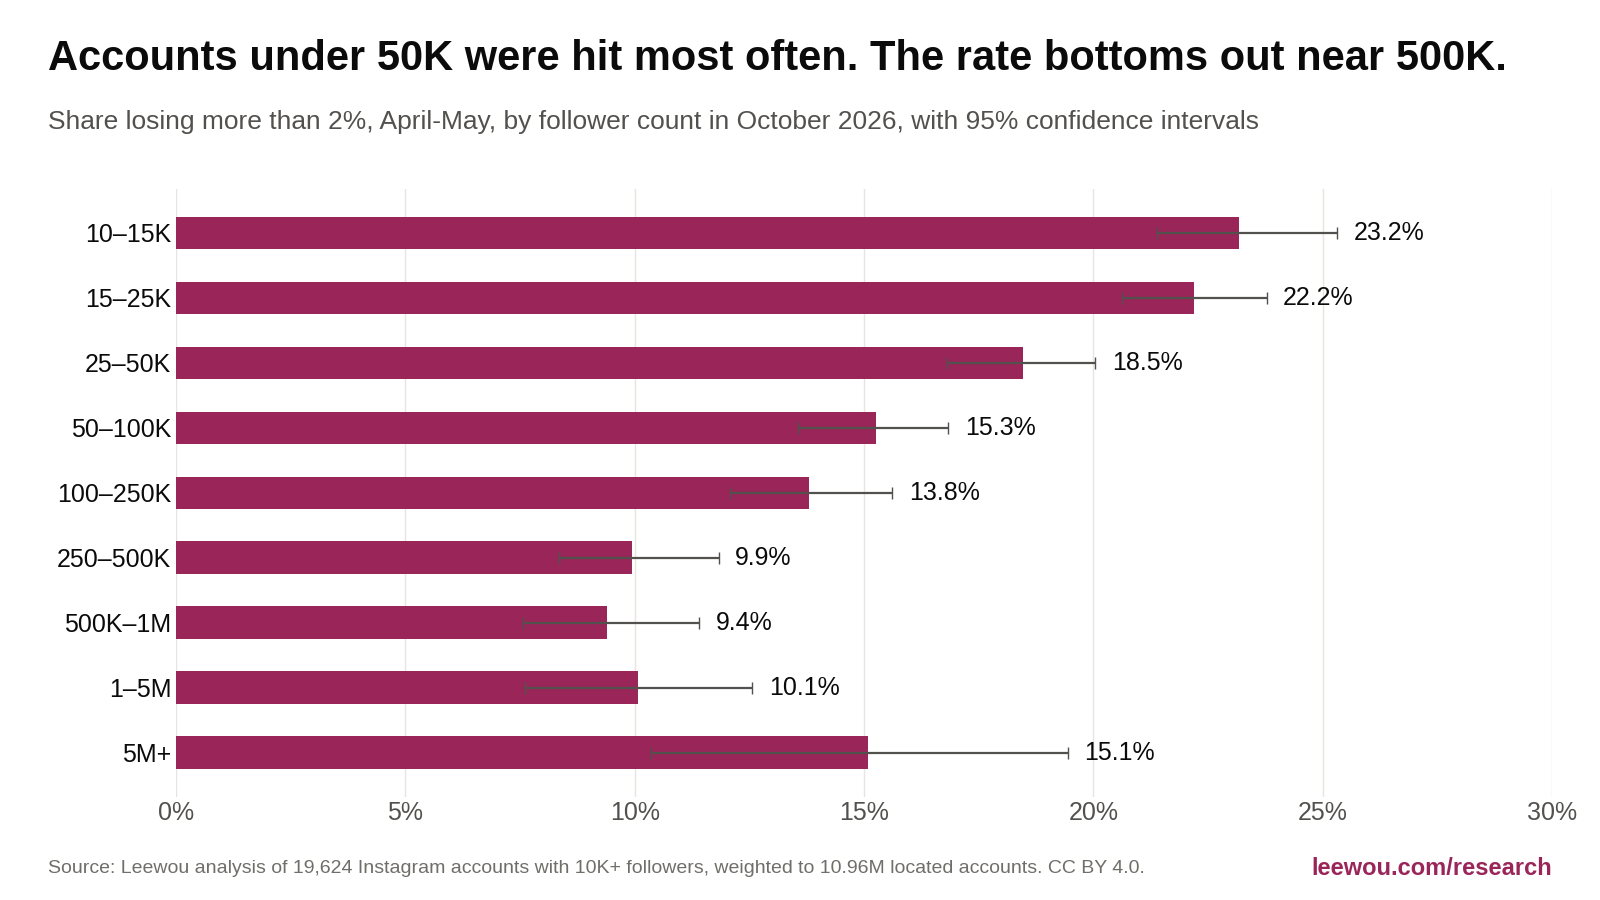
| Followers (Oct 2026) | n | Median | 95% CI | Lost >2% | 95% CI |
|---|---|---|---|---|---|
| 10–15K | 3,467 | -0.72% | -0.83 to -0.67 | 23.2% | 21.4 to 25.3 |
| 15–25K | 3,072 | -0.64% | -0.71 to -0.58 | 22.2% | 20.6 to 23.8 |
| 25–50K | 3,309 | -0.54% | -0.61 to -0.48 | 18.5% | 16.8 to 20.0 |
| 50–100K | 2,940 | -0.42% | -0.48 to -0.34 | 15.3% | 13.6 to 16.8 |
| 100–250K | 2,341 | -0.38% | -0.42 to -0.32 | 13.8% | 12.1 to 15.6 |
| 250–500K | 1,581 | -0.23% | -0.29 to -0.14 | 9.9% | 8.4 to 11.8 |
| 500K–1M | 1,220 | -0.34% | -0.41 to -0.22 | 9.4% | 7.6 to 11.4 |
| 1–5M | 890 | -0.65% | -0.77 to -0.53 | 10.1% | 7.6 to 12.6 |
| 5M+ | 283 | -0.90% | -1.05 to -0.66 | 15.1% | 10.4 to 19.4 |
Geography split the effect sharply. Among 75 markets with enough data, Saudi Arabia (48.0%), Azerbaijan (47.6%), Russia (44.1%), Iran (43.3%) and Kuwait (42.2%) saw the most accounts lose more than 2%, against 2.3% in Paraguay, 3.4% in Denmark and 3.8% in Greece. Elsewhere in the Gulf the rate was closer to the global figure: 24.2% in the UAE, 22.6% in Qatar, 21.2% in Oman and 20.2% in Bahrain. Read this as where follower counts fell, not as a ranking of fake accounts. Audience-quality models can behave differently across regions and languages, and Russia and Iran restrict Instagram, which may leave more dormant accounts behind. We did not test either explanation.
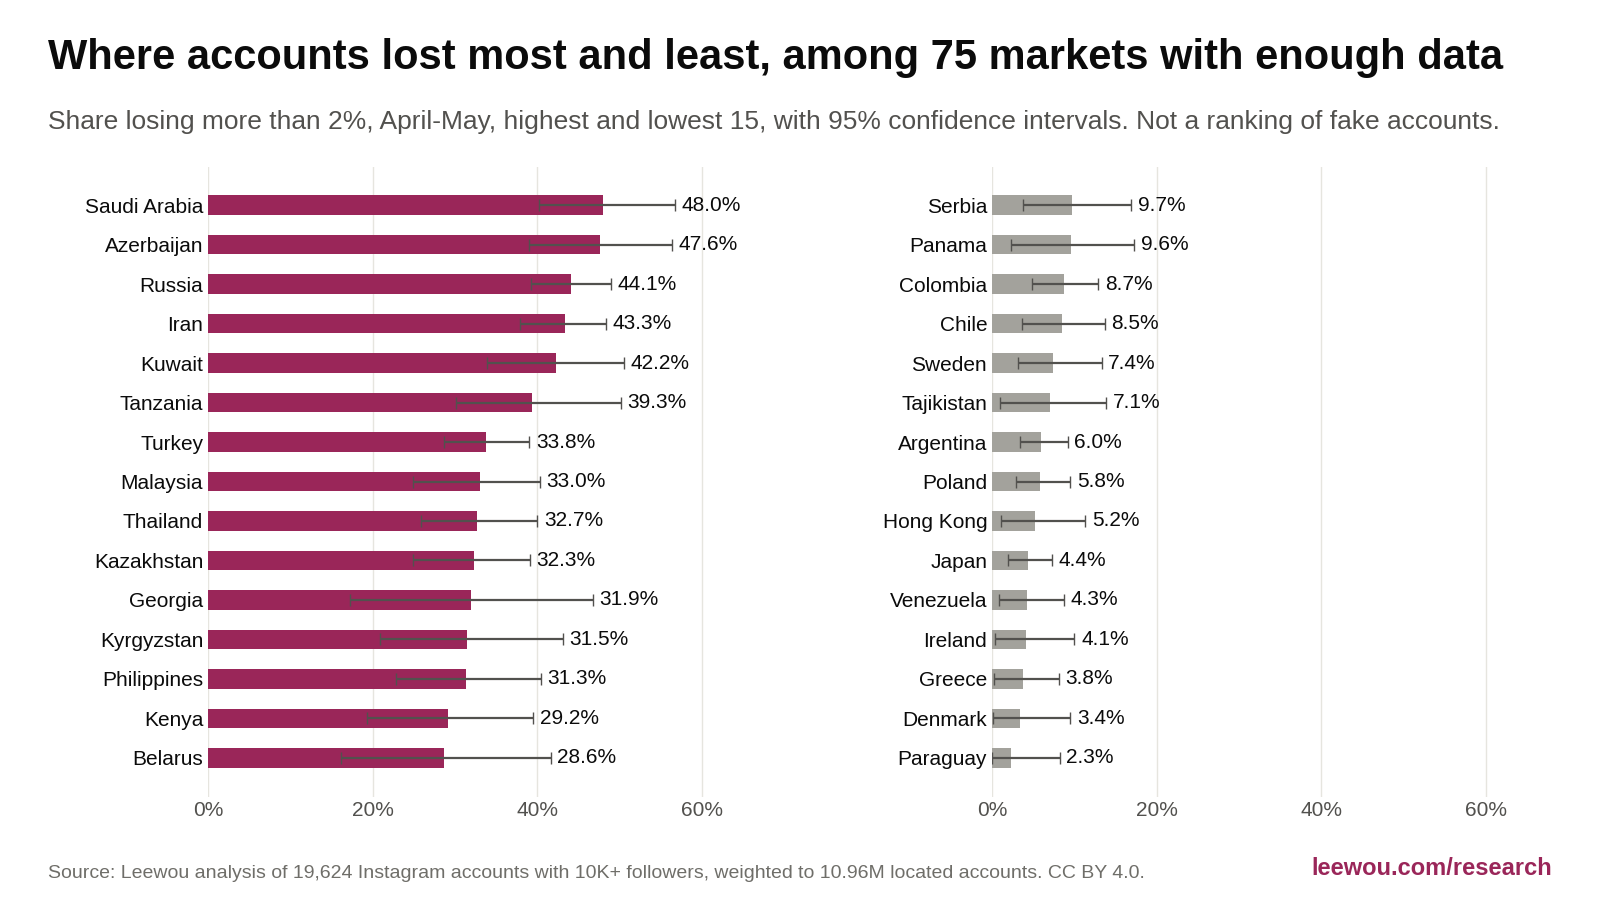
| Country | n | Median Apr-May | Lost >2% | 95% CI |
|---|---|---|---|---|
| Saudi Arabia | 308 | -1.88% | 48.0% | 40.2 to 56.7 |
| Azerbaijan | 172 | -1.86% | 47.6% | 39.0 to 56.3 |
| Russia | 561 | -1.68% | 44.1% | 39.2 to 48.9 |
| Iran | 608 | -1.53% | 43.3% | 37.9 to 48.3 |
| Kuwait | 161 | -1.35% | 42.2% | 33.9 to 50.5 |
| Tanzania | 129 | -1.57% | 39.3% | 30.1 to 50.1 |
| Turkey | 525 | -1.20% | 33.8% | 28.7 to 39.0 |
| Malaysia | 213 | -1.14% | 33.0% | 24.9 to 40.3 |
| Thailand | 260 | -0.95% | 32.7% | 25.9 to 40.0 |
| Kazakhstan | 248 | -1.09% | 32.3% | 24.9 to 39.1 |
| Georgia | 50 | -0.88% | 31.9% | 17.2 to 46.7 |
| Kyrgyzstan | 97 | -1.27% | 31.5% | 20.9 to 43.1 |
| Philippines | 153 | -0.93% | 31.3% | 22.8 to 40.4 |
| Kenya | 102 | -0.78% | 29.2% | 19.3 to 39.5 |
| Belarus | 73 | -0.84% | 28.6% | 16.2 to 41.6 |
| Serbia | 86 | -0.30% | 9.7% | 3.8 to 16.9 |
| Panama | 87 | -0.33% | 9.6% | 2.3 to 17.3 |
| Colombia | 302 | -0.41% | 8.7% | 4.8 to 12.9 |
| Chile | 142 | +0.05% | 8.5% | 3.7 to 13.7 |
| Sweden | 101 | -0.18% | 7.4% | 3.1 to 13.3 |
| Tajikistan | 55 | -0.56% | 7.1% | 1.0 to 13.9 |
| Argentina | 373 | -0.09% | 6.0% | 3.4 to 9.2 |
| Poland | 190 | -0.17% | 5.8% | 2.9 to 9.5 |
| Hong Kong | 81 | -0.07% | 5.2% | 1.1 to 11.3 |
| Japan | 289 | -0.26% | 4.4% | 1.9 to 7.3 |
| Venezuela | 157 | -0.05% | 4.3% | 0.9 to 8.7 |
| Ireland | 69 | +0.17% | 4.1% | 0.4 to 10.0 |
| Greece | 122 | -0.16% | 3.8% | 0.3 to 8.1 |
| Denmark | 83 | -0.07% | 3.4% | 0.1 to 9.5 |
| Paraguay | 76 | +0.15% | 2.3% | 0.0 to 8.2 |
Did accounts get their followers back?
Mostly not. By September, only 3.8% of accounts that lost more than 2% were back at their April count (95% CI 2.9% to 4.8%), against 45.8% of all other accounts. Their median sat 4.5% below April and was still slipping.
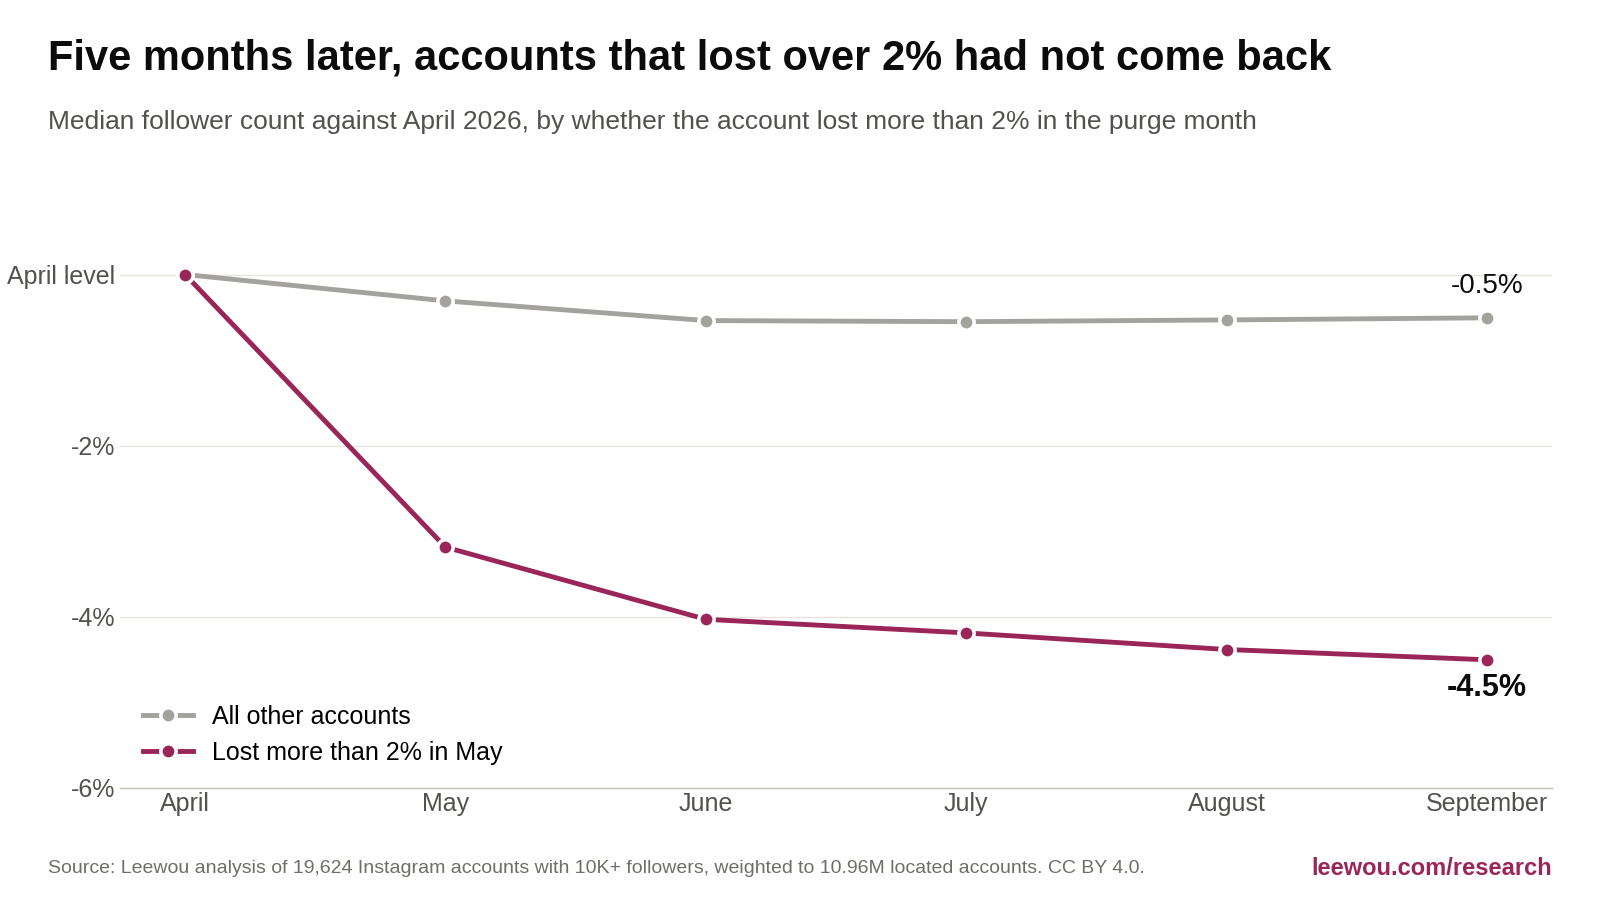
| Month | Lost >2% in May: median vs April | n | All others: median vs April | n |
|---|---|---|---|---|
| April | 0.00% | 3,284 | 0.00% | 15,819 |
| May | -3.19% | 3,284 | -0.31% | 15,819 |
| June | -4.03% | 3,284 | -0.54% | 15,819 |
| July | -4.19% | 3,284 | -0.55% | 15,819 |
| August | -4.39% | 3,284 | -0.53% | 15,819 |
| September | -4.51% | 3,284 | -0.51% | 15,819 |
Did the purge change engagement rate?
Barely. With likes held constant, the follower loss lifts the median account's engagement rate by 0.55% in relative terms, which turns a 1.00% rate into about 1.01%. Even among accounts that lost more than 2%, the lift is 3.3%, turning 3.00% into about 3.10%. A creator's rate before and after May is comparable, and you can check any account with the Instagram engagement rate calculator.
Likes did not fall alongside followers. Among accounts still posting that lost more than 2%, followers fell a median 2.9% while average likes per post changed by a median 0.0%. That fits followers who were not liking posts, but treat it as suggestive: average likes is a rolling, lumpy figure, and it often does not move at all.
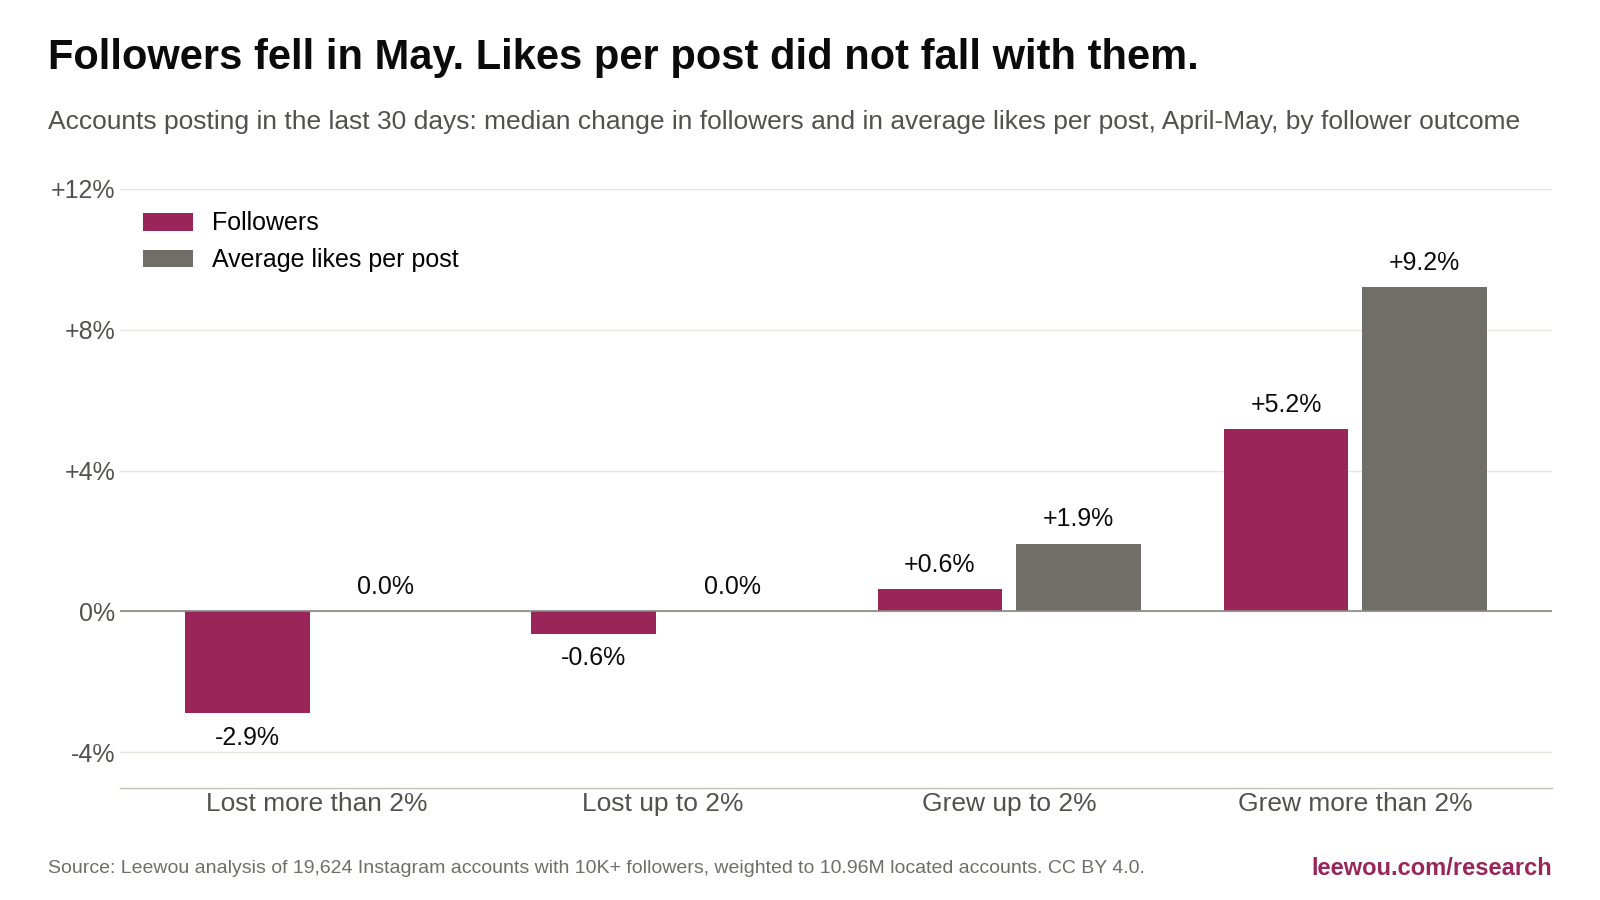
| Follower outcome, Apr-May | n | Median followers | Median likes per post | 95% CI |
|---|---|---|---|---|
| Lost more than 2% | 889 | -2.9% | 0.0% | 0.0 to 0.0 |
| Lost up to 2% | 4,680 | -0.6% | 0.0% | 0.0 to 0.0 |
| Grew up to 2% | 2,903 | +0.6% | +1.9% | 1.2 to 3.2 |
| Grew more than 2% | 1,924 | +5.2% | +9.2% | 6.2 to 11.1 |
Was there a second Instagram purge in October 2026?
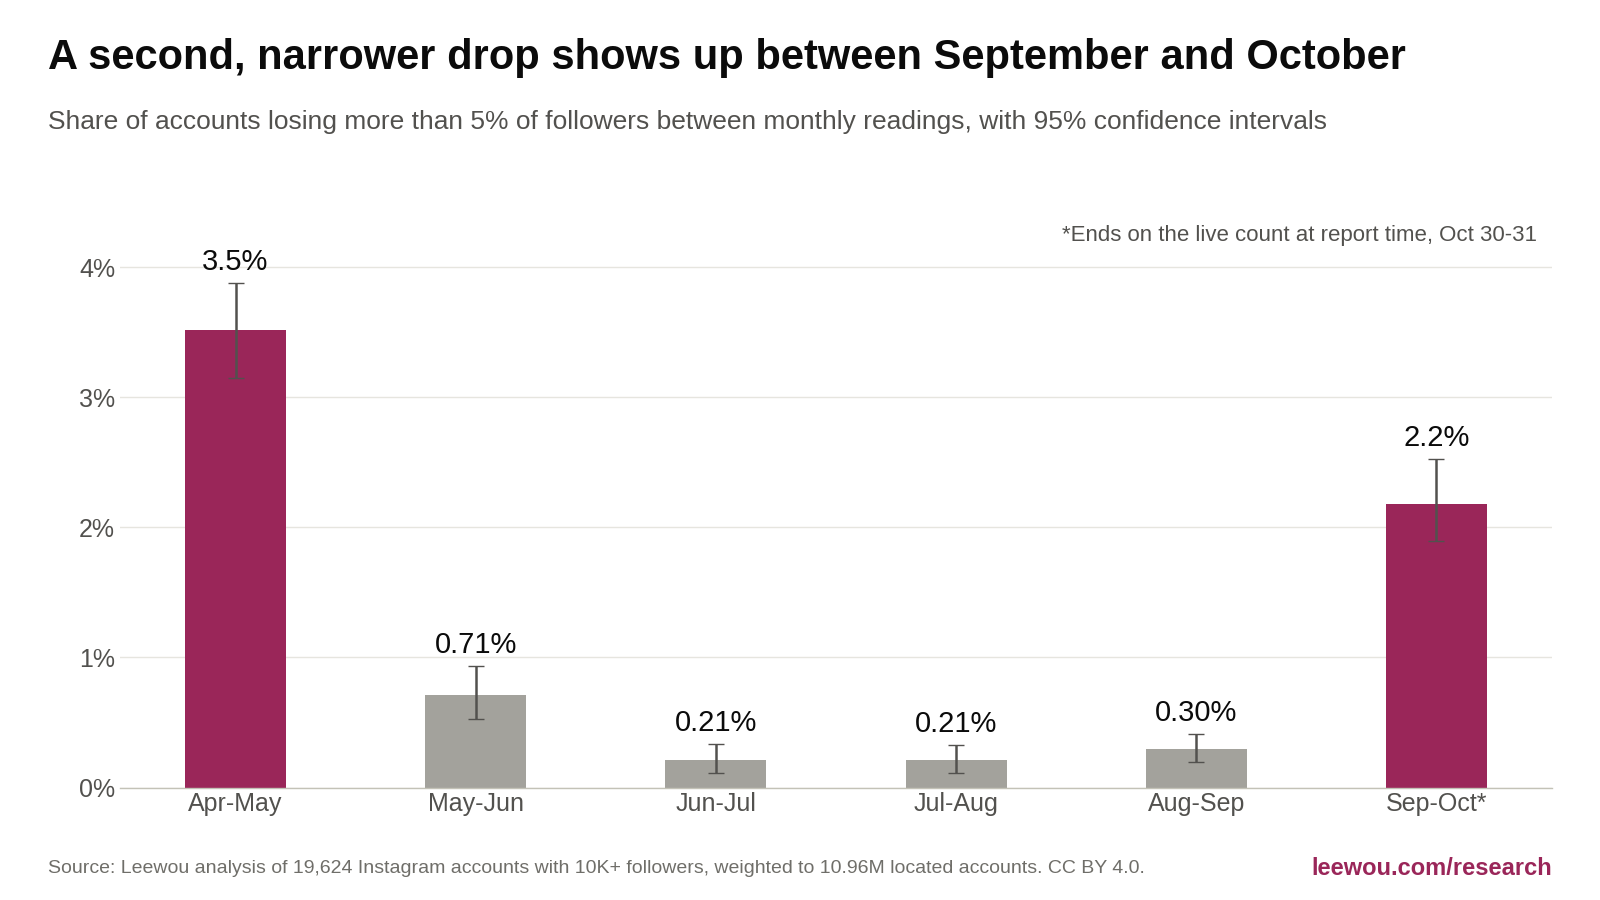
We can't call it a purge, but something did happen: 2.2% of accounts lost more than 5% between the September reading and October 30 to 31, against 0.2% to 0.3% in normal months. We found no announcement of it, and we don't know the cause.
| Transition | Lost >5% | 95% CI | n |
|---|---|---|---|
| Apr-May | 3.52% | 3.14 to 3.87 | 19,103 |
| May-Jun | 0.71% | 0.53 to 0.94 | 19,226 |
| Jun-Jul | 0.21% | 0.11 to 0.33 | 19,308 |
| Jul-Aug | 0.21% | 0.11 to 0.32 | 19,404 |
| Aug-Sep | 0.30% | 0.20 to 0.41 | 19,542 |
| Sep-Oct* | 2.18% | 1.89 to 2.52 | 19,564 |
We tried to break this finding, because a monthly reading that was still open when we collected it can mislead. The drop is not rounding: exact round numbers are rare in every month. It survives the month closing: when we re-fetched profiles in November, 331 of them returned a closed October, and the share losing more than 5% moved only from 3.3% to 3.0%. The whole-population count shows it independently at 2.21%. And live counts from an independent source show 98 of 99 randomly chosen affected accounts still more than 5% below September. It also looks different from May. Verified and active accounts were hit as often as anyone, and Iran and Russia, at 20.3% and 10.3% of accounts losing over 5% in May, sit below 1%.
How many bots are on Instagram?
Nobody outside Meta can count them, and this study does not try. What we can report is how audiences score today. The median account with 10,000 or more followers has an estimated 8.5% suspicious followers, and 61% of those 11.44 million accounts have an audience credibility score of 0.75 or higher. These are modelled estimates about followers of large accounts. They are not a count of bot accounts on Instagram, and "suspicious followers" and "low credibility" are different measures.
What should brands and creators do now?
- Brands: compare creators on post-May numbers. A creator's April follower count is out of date, but their engagement rate is still comparable.
- Brands: don't treat a May drop as a red flag on its own. One account in five lost more than 2%. Look at audience quality and recent posting instead, with the fake follower checker or a full influencer audit.
- Creators: judge your month against the benchmark. Losing up to about 0.5% is ordinary. More than 2% outside an event like May is worth looking into.
- Creators: don't wait for May's followers to come back. Almost none did, and the accounts still posting held up best.
What this data can't tell you
- We only see survivors. We sampled accounts with 10,000+ followers in October. Deleted accounts and accounts that fell below 10,000 are missing. Excluding accounts close to that floor in April moves the headline only slightly, to -0.62% and 20.6%.
- These are net changes. We can't separate removed followers from people unfollowing or from new followers. The baseline comparison and the controls address this but don't remove it.
- Monthly readings, on an undocumented day. Our evidence places the reading around the 22nd of the month, roughly, which puts the May reading after the May 6 to 7 event. A drop and rebound inside one month would be invisible.
- Credibility and suspicious share are modelled estimates, measured in October, and may work less well in some regions and languages.
- Cold profiles behave differently. About 11% of reports had to be computed from scratch, and those accounts show less loss in May and more later, for reasons we could not fully establish. Without them the headline is -0.65% and 22.2%. We kept them because the pooled figure is closer to population counts on six of nine measures.
- Follower bands favor the top of each band. The way results are served pulls samples toward band ceilings. Reweighting within bands moves the headline to -0.55% and 19.6%.
- Accounts are not people. One person can run many accounts, and about 4% of accounts have no known country and are not in the weighted figures.
- The live check confirms today's counts, not past ones. We can't independently verify April's values, and they can't be re-collected, because our monthly history keeps a rolling seven months and April has now rolled off.
Download the data and cite this study
All data is free to use under CC BY 4.0, with no email required. We only publish aggregates, and we don't name individual accounts. If you need a cut by country, size or niche that isn't here, write to support@leewou.com.
Data files (CSV)
- monthly-change-by-platform.csvInstagram, TikTok and YouTube: median, percentiles and loss shares for each month, with n and confidence intervals.
- purge-by-tier.csvApril-May change by follower band, weighted and unweighted, plus first-attempt-only figures.
- purge-by-credibility.csvApril-May change by audience credibility band, beside a normal month.
- purge-by-country.csvApril-May change for all 115 countries with at least 30 accounts, flagged where precision is too low to rank.
- normal-monthly-change-by-tier.csvThe normal-month benchmark by follower band.
- sample-vs-population-check.csvOur weighted sample against whole-population counts, on nine measures.
- live-validation-summary.csvHow follower counts compared with an independent live source, and the spot-check of October's drop.
This study uses the same proprietary creator data behind Leewou, our influencer discovery platform.
Corrections
If a number on this page changes, the change is logged here with its date. Found a problem? Write to support@leewou.com.
| Date | Change |
|---|---|
| 2026-11-01 | First published. No corrections yet. |